|
||
• wydawnictwa polskie
• Zamów informacje o nowościach z wybranego tematu • kontakt
• Cookies na stronie |
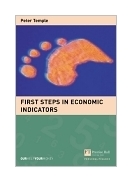
FIRST STEPS IN ECONOMIC INDICATORSTEMPLE P.wydawnictwo: FT/PH , rok wydania 2004, wydanie Icena netto: Covering all the major indicators reported by private and government statistical agencies - including the pricing index, employment figures, retail sales, housing - this comprehensive resource provides full descriptions of indicators and what they represent, their impact on the direction of interest rates, exchange rates, and the stock market, and how and why the market reacts as it does. The book also offers brief guidelines for gearing your investment strategies to these ever-changing economic statistics. Written in a clear non-technical terms and clearly organized by sectors of the economy, this accessible guide: - takes a closer look at GDP, with an overview of the macro-economic framework using the standard national income computing methodology, - compares and contrasts consumer sector indicators to distinguish which series are more reliable and consistent, - differentiates between all measures of inflation, and makes the key distinction between inflation in the goods market and inflation in the services market, - explores foreign market indicators, including the monthly and quarterly indicators for the foreign exchange, domestic bond and equity markets, - features revealing "did you know?" titbits and cautionary tales, as well as special factors unique to specific indicators. "Peter is, as usual,
informed and informative. This is a useful tool for all investors." "Absolutely vital to
new and experienced investors and market followers alike. Market indicators are too often
overlooked by investors - this very readable and comprehensive book makes perfect sense of
these essential tools". "Economists are of two
kinds, those who make simple things complicated and those who make complicated things
simple. Peter Temple makes complicated things simple. The book is an ideal introduction to
financial market indicators for the layman." "Peter Temple is one of
those very rare breeds that has considerable experience on a practical basis in financial
markets, whilst at the same time having the creative skill of being able to translate that
knowledge coherently and descriptively to his audience. This book is a must for the
investment portfolio!" Peter Temple was born in West Yorkshire and has a degree in economics and statistics from the University of Wales, where he won the Eames Prize for Economics in 1970. He is a former member of the London Stock Exchange and a Fellow of the Securities Institute. He spent the first 18 years of his working life in fund management and investment banking, turning to full-time writing in 1988. His articles cover a wide variety of topics on business, finance and investment and appear regularly in the Financial Times, Shares, International Fund Investment, and on the Ample Interactive Investor website. He also edits the Zurich Club Communique, an investment newsletter. He has written several other books about investing, covering topics such as online investing, venture capital and hedge funds, including First Steps in Shares, First Steps in Bonds and Traded Options, all published by FT Prentice Hall. Contents Introduction 1. How Economic Indicators
are Calculated 2. Who Collects and Issues
them? 3. Who Forecasts Them? 4. Prices and Money 5. What We Spend 6. The Work We Do 7. What We Earn, Save and
Borrow 8. How We Trade 9. Leading Indicators and
Other Stories 10. Oddball Indicators Glossary 214 pages
Po otrzymaniu zamówienia poinformujemy, |


