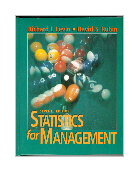
Statistics for Management,
7/e
Richard I. Levin , University
of North Carolina at Chapel Hil
David S. Rubin , University of North Carolina at Chapel Hil
Published June 1997 by
Prentice Hall Business Publishing
Copyright 1998, 1026 pp.
Cloth ISBN 0-13-476292-4
Summary
Appropriate for one or two
term courses in introductory Business Statistics. With Statistics for Management, Levin
and Rubin have provided a non-intimidating business statistics textbook that students can
easily read and understand. Like its predecessors, the Seventh Edition includes the
absolute minimum of mathematical/statistical notation necessary to teach the material.
Concepts are fully explained in simple, easy-to-understand language as they are presented,
making the text an excellent source from which to learn and teach. After each discussion,
readers are guided through real-world examples to show how textbook principles work in
professional practice.
Features
- Includes
easy-to-understand explanations of difficult statistical topics, such as...
- Sampling
distributions.
- Relationship
between confidence level and confidence interval.
- Interpreting
"r-square".
- Provides
a complete package of teaching/learning aids in every chapter, including...
- Chapter
review exercises.
- Chapter
concepts tests.
- "Statistics
at Work" conceptual cases.
- "Computer
Database Exercises.
- "From
the Textbook to the Real-World Examples".
- Flow
charts.
- Chapter
glossaries.
- Chapter
learning objectives.
- Assumptions
and hints boxes.
- Real-world
exercises.
- Chapter-opening
problems (worked later in chapter).
- Equations
introduced and explained sections.
- Marginal
notes.
- Omits
complex notation in favor of graphic and verbal explanations, including...
- Explanation
of the Poisson distribution.
- Standard
error of the difference between two means.
- Explanation
and decomposition of deviation.
- Offers
more total exercises than any other text, such as...
- In-chapter
exercises (both basic and applications- oriented).
- Self-check
exercises with worked out answers in each section.
- End-of-chapter
review exercises with each chapter.
- Real-world
exercises in each chapter.
- Chapter
concepts test exercises in each chapter.
Table of Contents
1. Introduction.
2. Grouping and Displaying Data to Convey Meaning: Tables and Graphs.
3. Measures of Central Tendency and Dispersion in Frequency Distributions.
4. Probability I: Introductory Ideas.
5. Probability Distributions.
6. Sampling and Sampling Distributions.
7. Estimation.
8. Testing Hypotheses: One Sample Tests.
9. Testing Hypotheses: Two-Sample Tests.
10. Quality and Quality Control.
11. Chi-Square and Analysis of Variance.
12. Simple Regression and Correlation.
13. Multiple Regression and Modeling.
14. Nonparametric Methods.
15. Time Series and Forecasting.
16. Index Numbers.
17. Decision Theory.
Appendix Tables.
Księgarnia nie działa. Nie odpowiadamy na pytania i nie realizujemy zamówien. Do odwolania !.


